
Daily Audit
Review the day’s marketing-ops audit (sends, bounces, unsubs, form submissions, net-new leads) with anomalies flagged against your baseline.
Supported MAPEloquaMarketo
Open Daily Audit from Home or go to /agents/daily-audit. Like other Agent Studio agents, you work in a chat + panel workspace: ask about yesterday’s numbers or a spike in chat; the panel shows the dashboard, the day’s record, and history.
What gets collected, custom metrics from Marketo smart lists, and anomaly email digests are configured in Daily Audit settings for your connection.
Configuring collection? Admins set coverage, anomaly email, and (on Marketo) custom metrics under Daily Audit settings (
/settings/agents/daily-audit in the product).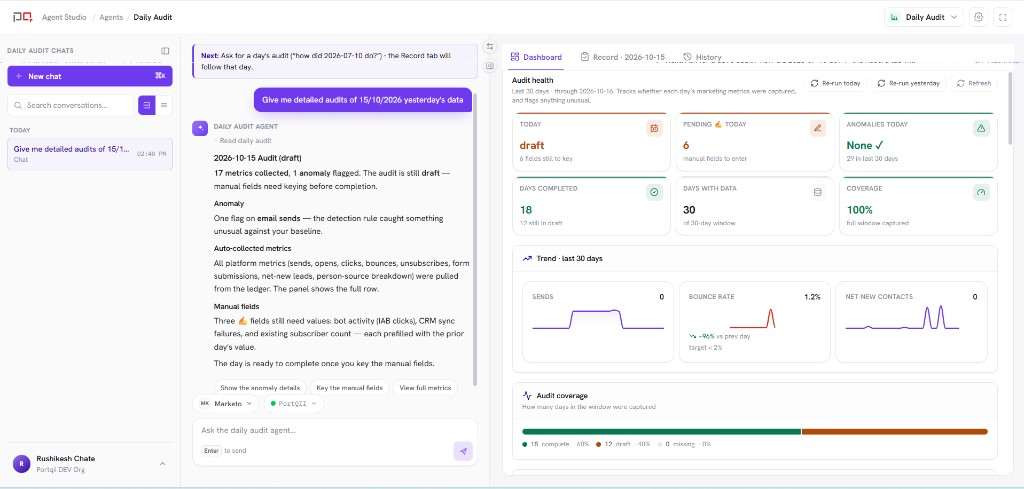
/images/agent-studio/daily-audit/workspace-overview.pngDaily Audit at /agents/daily-audit, chat on the left with a question about yesterday, panel on the Dashboard tab showing trends across recent days. Use a demo instance.
Before you start
- An active MAP connection (Eloqua or Marketo)
- Coverage configured so the day can be collected (see settings). Marketo connections can also add custom metrics from smart lists.
- Optional: anomaly digest recipients so ops get an email when yesterday has flags
Review a day
Open Daily Audit
From Home, choose Daily Audit, or open
/agents/daily-audit.Scan the dashboard
Start on Dashboard for trends and at-a-glance metrics across recent days.
Open a day’s record
Select Record (or ask chat for a date). Review collected metrics, expected ranges, and any flagged anomalies.
Triage anomalies
Confirm a real anomaly or dismiss a false alarm so the agent learns which metrics are noisy for your org. Feedback is reversible.
Key manual fields
Some metrics are not API-exposed. Enter those on the record, then select Save & complete so the day is complete.
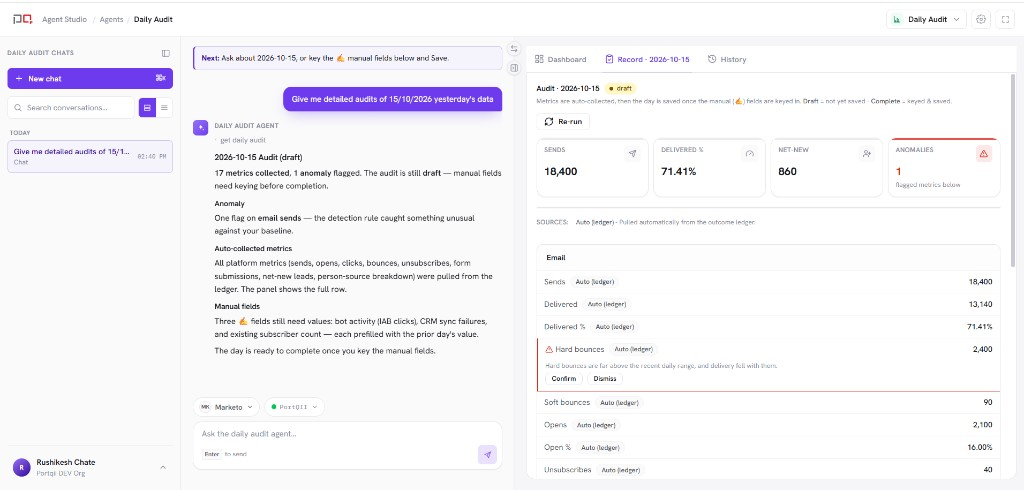
/images/agent-studio/daily-audit/day-record-anomaly.pngDaily Audit panel, Record tab for yesterday, with one anomaly flagged showing its expected range and the confirm or dismiss controls, plus the manual fields and Save & complete. Use a demo instance.
Panel tabs
| Tab | Use it to |
|---|---|
| Dashboard | See trends and headline metrics across days. |
| Record | Inspect one audit day: metrics, provenance, anomalies, and manual entry. |
| History | Browse past collected days for this connection. |
Chat + day focus. Asking about a date focuses that day’s record in the panel. Digest emails can deep-link straight to a connection and date.
Day not collected? Confirm the connection is active and settings coverage/mappings are in place. History shows which days exist. On a day's record you can select Run audit now to collect it.
Related
Daily Audit settings
Connections
Agents