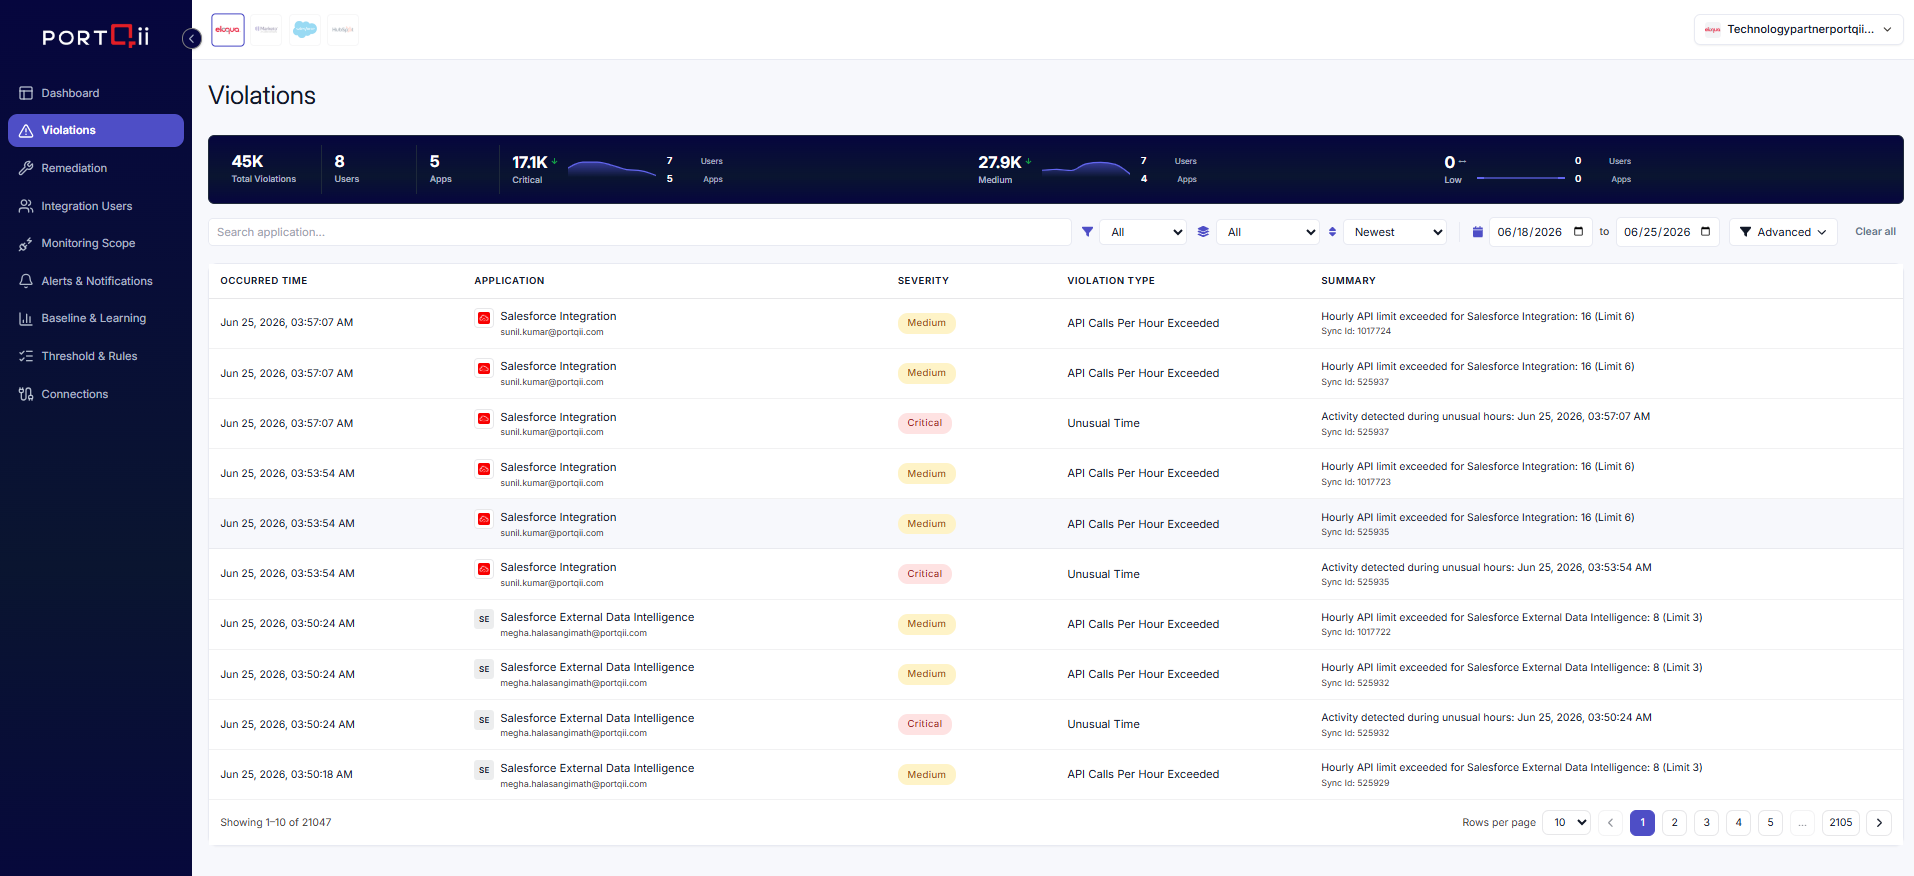
The Violations page is the central place to review issues that Security Compliance has detected — for example, unusually large syncs, activity outside normal hours, or breaches of the thresholds you have configured. It combines a metrics summary with a detailed, filterable table.
Violation metrics
The cards at the top of the page summarise the current state of violations:
- Total violations detected in the selected period.
- Unique users affected.
- Applications involved.
- Severity breakdown — Critical, Medium, and Low counts, each with a trend indicator and the number of affected users and apps.

Violations table
Below the metrics, the violations table lists each detected event. Columns include:
| Column | Description |
|---|---|
| Occurred | Date and time the violation was detected. |
| Application | The application involved, shown with its logo and the affected user's email. |
| Severity | Colour-coded badge: Critical, Medium, or Low. |
| Violation type | The rule that was triggered. |
| Summary | The reason for the violation, with the related resource identifier (Sync ID for Eloqua, Job ID for Salesforce) where applicable. |
Filtering & search
Use the controls above the table to narrow the list:
- Search by application name.
- Severity — All, Critical, Medium, or Low.
- Category — All, Applications, or Bulk API.
- Sort order — Newest or Oldest first.
- Date range — choose start and end dates (defaults to the last 7 days).
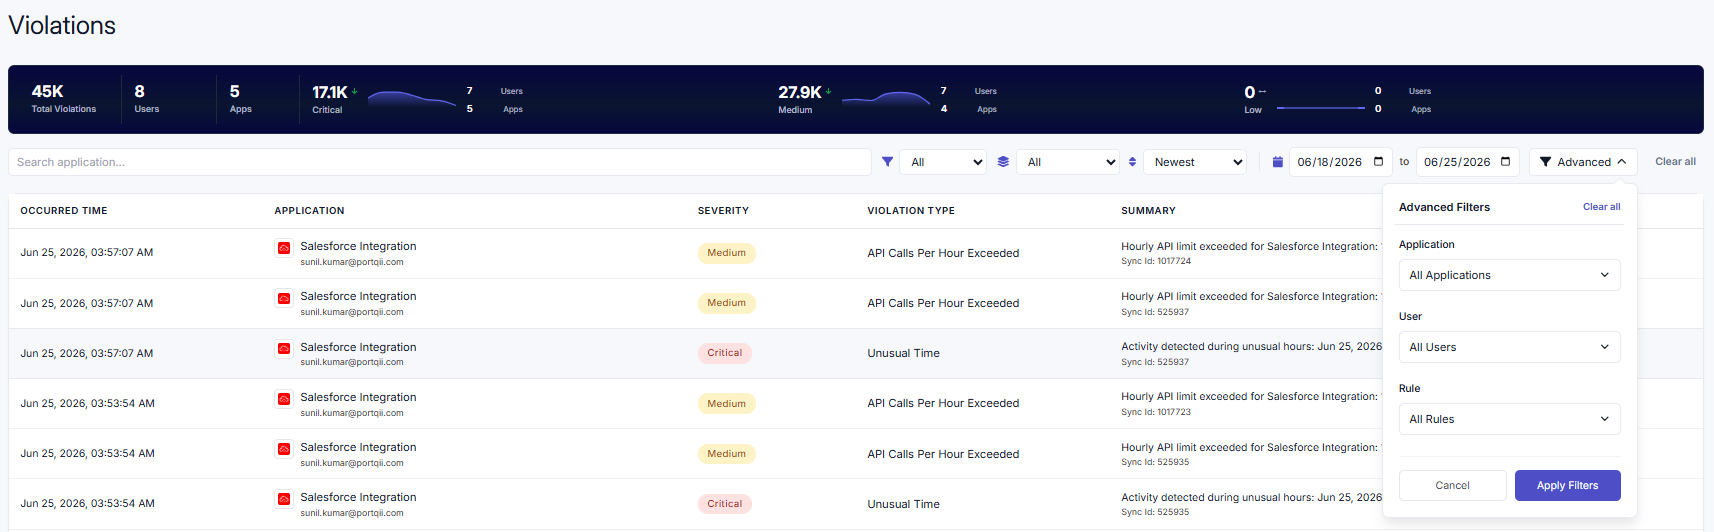
- Advanced filters — refine by specific Application, User, or Rule using searchable dropdowns.
Select Clear all to reset every active filter. On smaller screens the filters collapse into a side panel.
Selecting violations
Each row has a checkbox, and the header checkbox selects every violation on the page. Selecting violations here lets you carry them forward into a bulk action on the Remediation page.