Your dashboard gives you a quick overview of key email marketing metrics across your Eloqua campaigns.
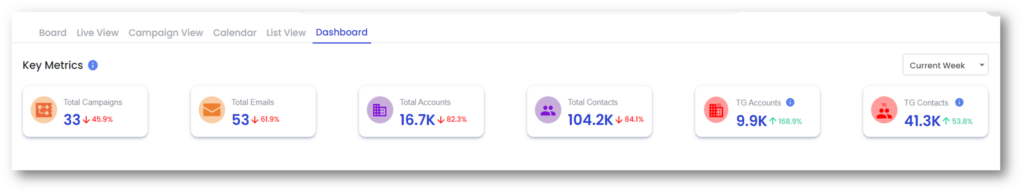
Click on any metric to drill down into campaign-level details.
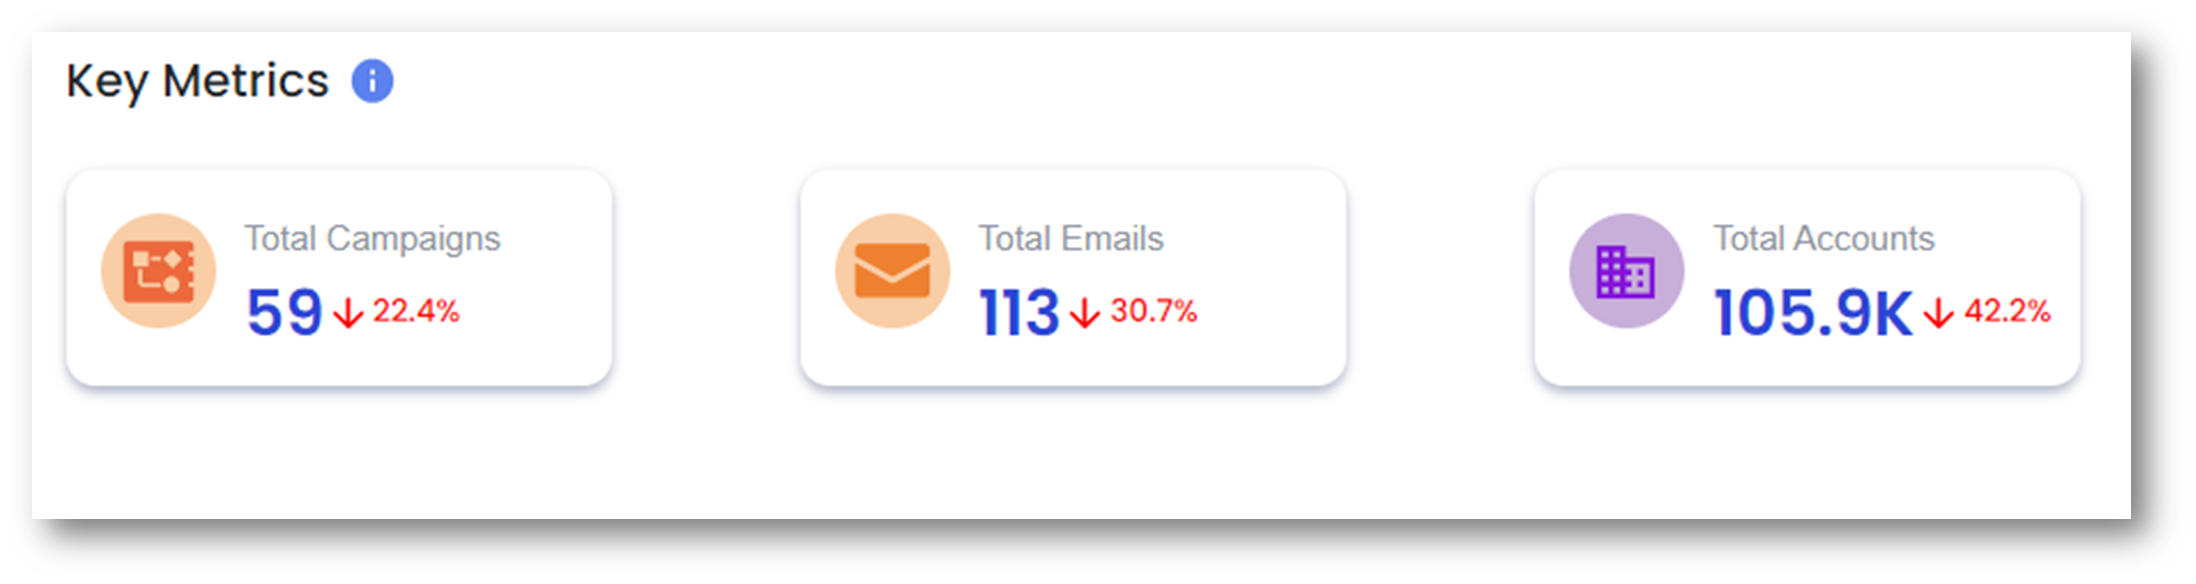 |
Total Campaigns: Number of campaigns sending email in the current week Total Emails: Number of unique Eloqua emails involved in the total sends Total Accounts: Number of accounts that will receive emails in the week |
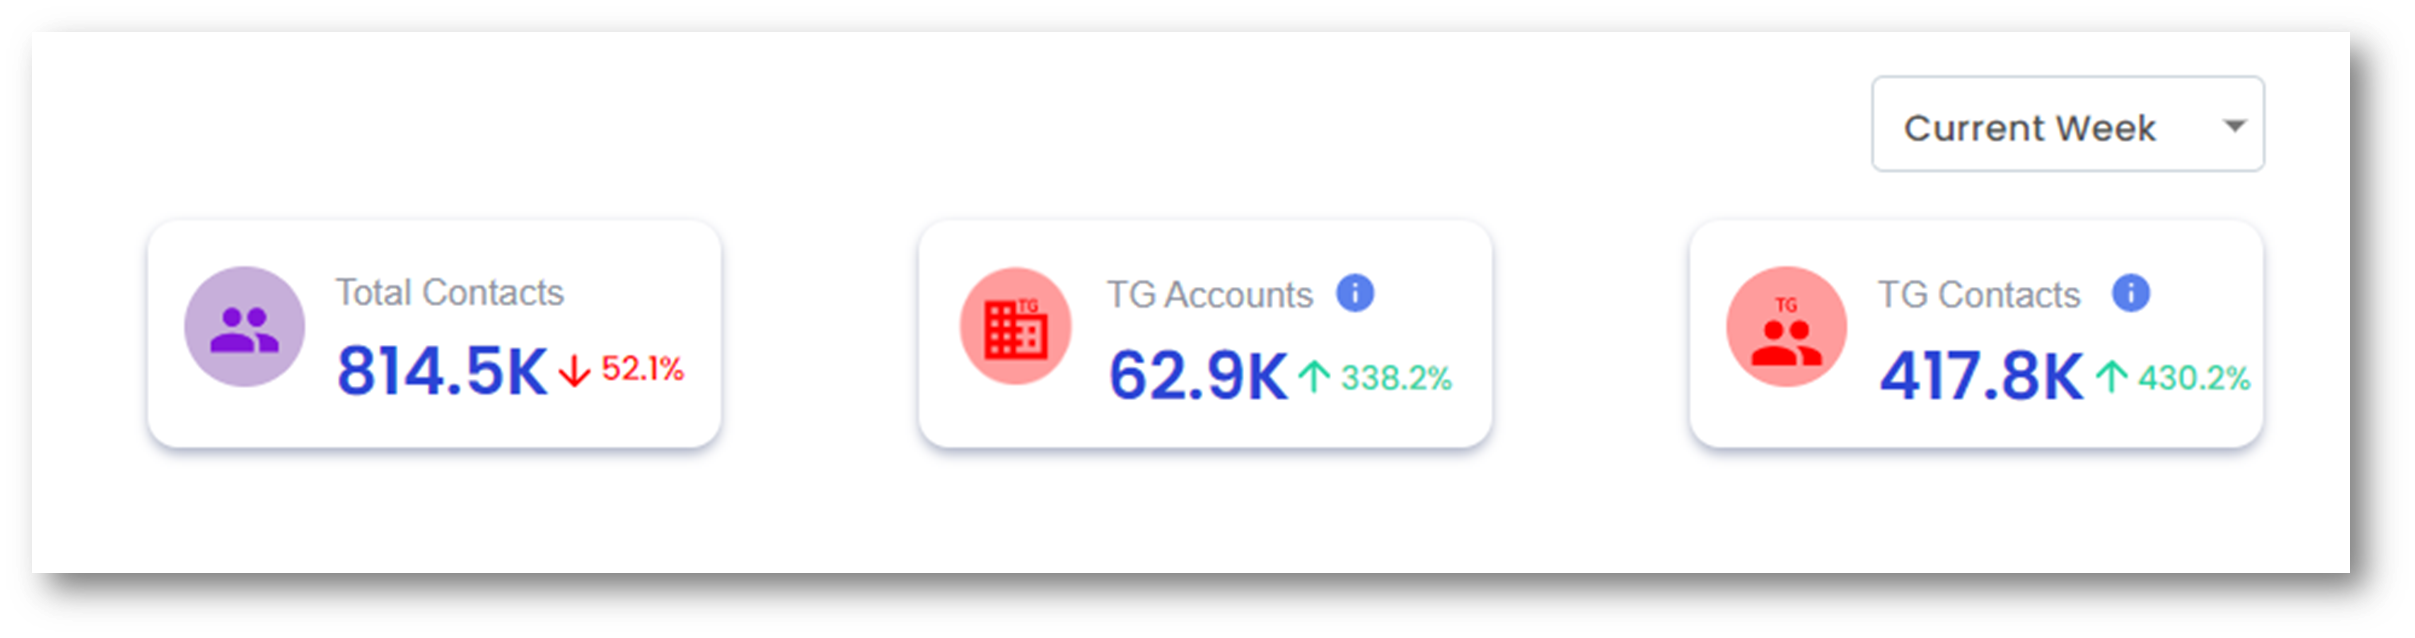 |
Total Contacts: Number of contacts that will receive emails in the week TG Accounts: Number of accounts for which TG rules were violated TG Contacts: Number of contacts for which TG rules were violated |
Each graph shows historical trends for the metric, while the numbers at the top reflect current week data.
Total Contacts – Change over time
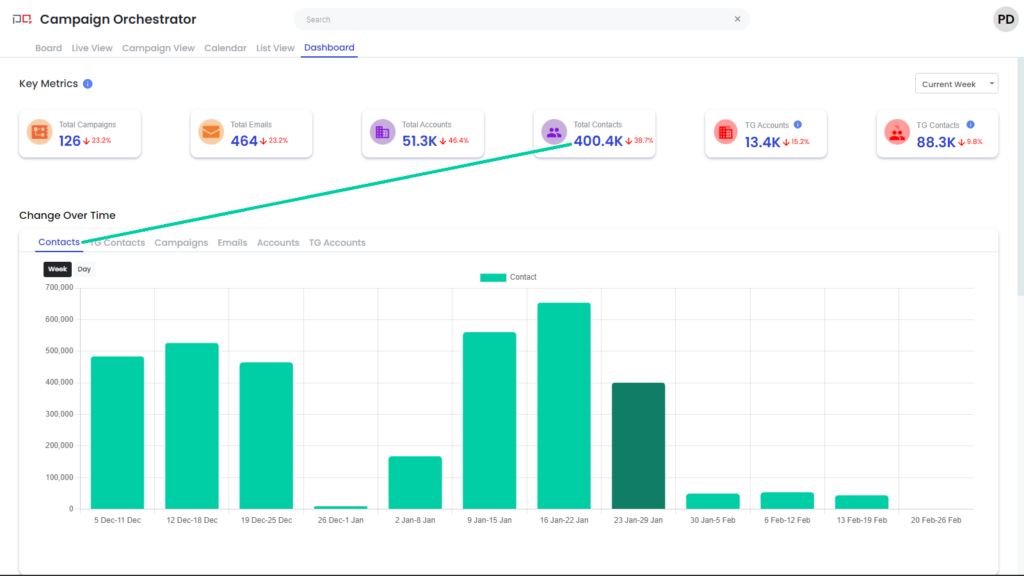
This chart shows the weekly count of contacts targeted by your Eloqua campaigns.
Touch Governance (TG) Contacts
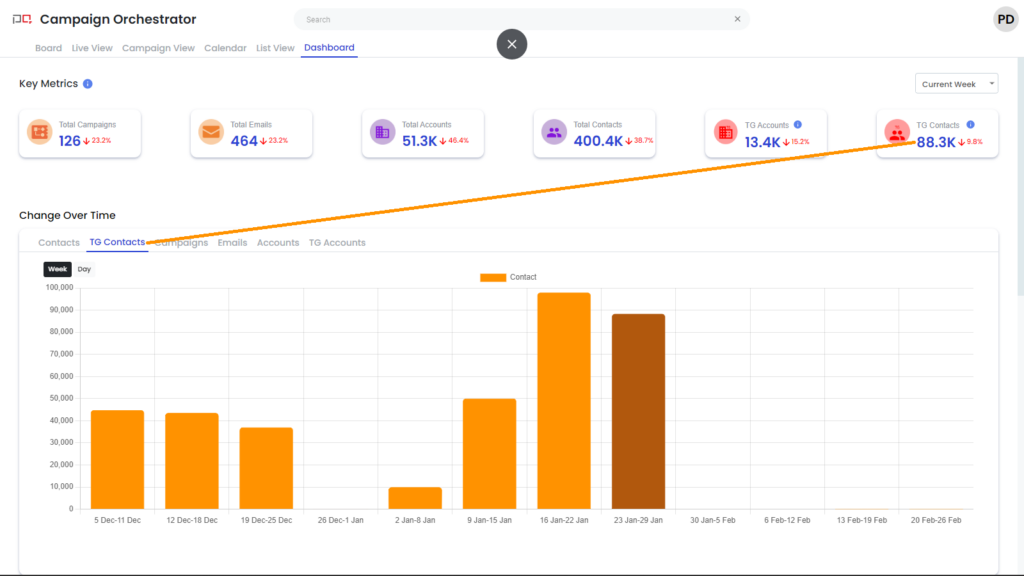
This chart tracks the weekly count of contacts with Touch Governance violations.
Total Campaigns
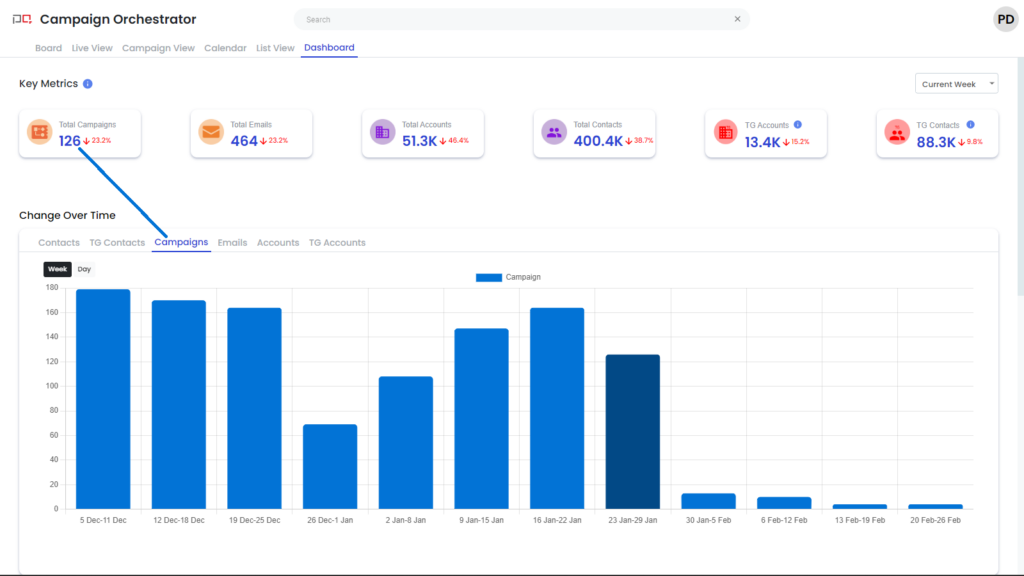
This chart shows the weekly count of campaigns that sent emails.
Total Emails
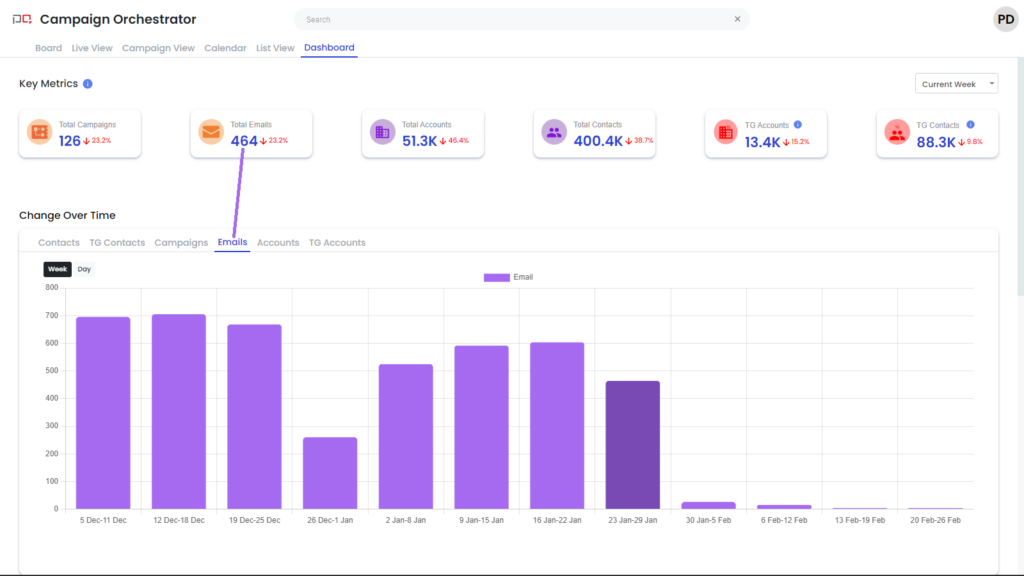
This chart displays the weekly count of unique Eloqua emails sent.
Accounts – Change over time
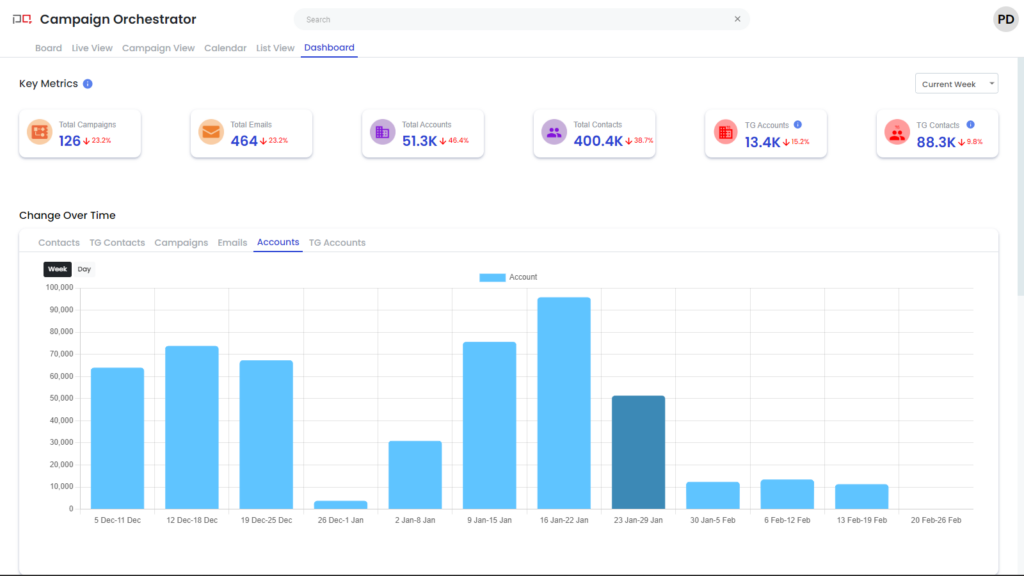
This chart shows the weekly count of accounts targeted by your campaigns.
Touch Governance (TG) Accounts – Change over time
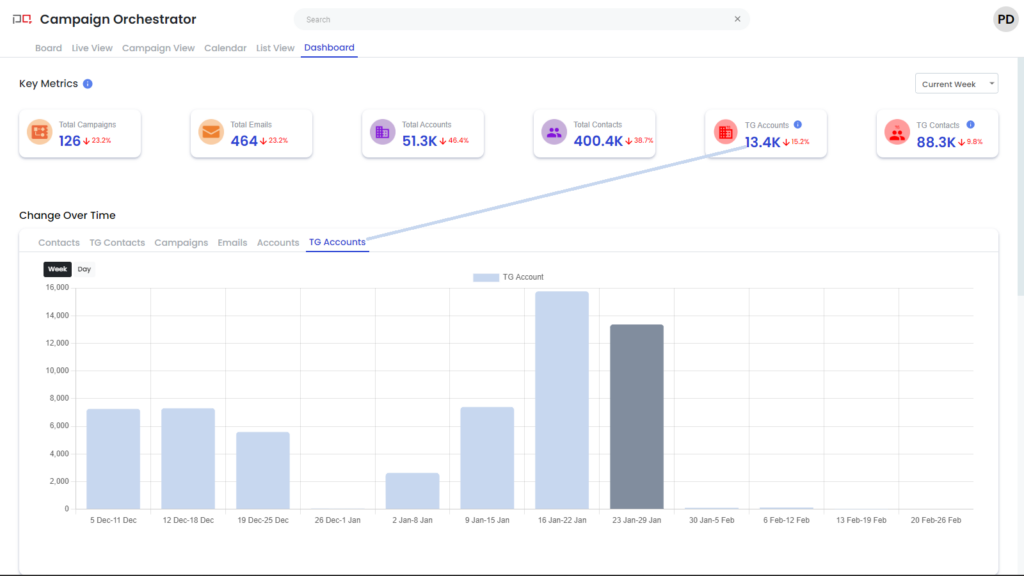
This chart tracks the weekly count of accounts with Touch Governance violations.